Location data 2021-22
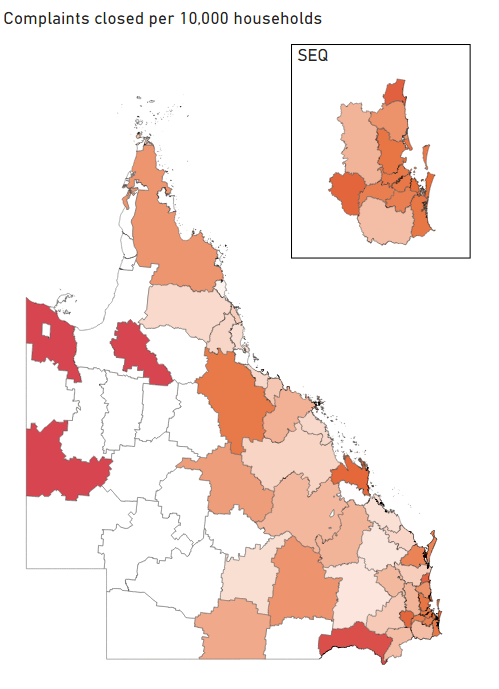
Complaints closed per 10,000 households

Complaints by Local Government Area
Location figures are for complaints during 2021-22 where an incident address was provided and excludes non-residential complaints.
Local Government Area | Complaints closed | Households | Complaints per |
|---|---|---|---|
| Brisbane (C) | 1,127 | 489,838 | 23 |
| Gold Coast (C) | 595 | 257,437 | 23.1 |
| Moreton Bay (R) | 431 | 184,965 | 23.3 |
| Logan (C) | 267 | 122,430 | 21.8 |
| Sunshine Coast (R) | 263 | 142,603 | 18.4 |
| Ipswich (C) | 199 | 911,89 | 21.8 |
| Redland (C) | 154 | 61,966 | 24.9 |
| Fraser Coast (R) | 97 | 46,225 | 21 |
| Noosa (S) | 78 | 23,892 | 32.6 |
| Toowoomba (R) | 61 | 67,905 | 9 |
| Cairns (R) | 60 | 70,641 | 8.5 |
| Townsville (C) | 52 | 77,936 | 6.7 |
| Lockyer Valley (R) | 47 | 15,977 | 29.4 |
| Livingstone (S) | 41 | 14,825 | 27.7 |
| Mackay (R) | 31 | 46,478 | 6.7 |
| Bundaberg (R) | 30 | 41,806 | 7.2 |
| Scenic Rim (R) | 20 | 17,708 | 11.3 |
Only Local Government Areas with 20 or more complaints during 2021-22 have been included.